Basic UVM testbench for a Stream Processor
Other projects
next section →
This page: A specific Device Under Test


A specific Device Under Test

A DUT that does something worth testing

Calculating the Person's r correlation coefficient

I've thrown together a noddy "Hello world" Stream Processor (HWSP) DUT in order to get the testbench set up. This device will do something representative of its intended function: some math. The HWSP has 8 parallel identical independent oneproc units, each of which scans data frames of length S for semi-randomized versions of the string "Hello world" and provides two values: the highest correlation coefficient with the string "Hello world" found in S, and an index of the offset from S[0] where that correlation coefficient was found. Mangled strings may be an odd use of correlation, but this is just a simple and easy to understand process for the sake of the testbench. As a picture:


This problem is a micro version of detecting patterns in streams of data. Real world versions of this problem include not merely looking for a known pattern, but finding meaningful correlations with no initial pattern to match. Our future is data finding meaning in other data.
So,
  • Frames of data S characters long have semi-randomized versions of the string "Hello world", henceforth "HW", in them.
  • The base string HW has each character take a random step in the range of -50 to +50 from its starting "Hello world" value.
  • The resultant semi-randomized HW overwrites a field of 11 characters in the string S, also consisting of initially randomized characters.
  • Randomization always returns values between 32 and 126, which is the ASCII space character until the end of the printable characters.
  • For the first pass I've chosen a length of 32 characters, 32 bytes, for S. HW requires 11 bytes. This means that there are 21 possible positions HW can be placed in S.

    The first draft proof-of-concept C program HelloWorldMangler.c was used to perform the two functions: The first function is implemented by a UVM sequence generator. The second function will be incorporated into the scoreboard as the reference model, and of course it's the same function that the DUT HWSP will have to perform.

    As described, data records for this particular device comprise:
    start  |  dir  | Bytes |   Description
    -------+-------+-------+-------------------
    addr00 | write |   1   | frameID
    addr01 | write |   1   | CMMD
    addr02 | write |   1   | arg0
    addr03 | write |   1   | arg1
    addr04 | write |   1   | RS Reference array/string Starting address
    addr05 | write |   1   | RL Reference array/string Length
    addr06 | write |   1   | SS S[] array/random string Starting address
    addr07 | write |   1   | SL S[] array/random string Length
    addr08 | ---   |   1   | reserved
    addr09 | read  |   1   | status
    addr10 | read  |   1   | offset Returned value of the offset of maximum cc
    addr11 | read  |   1   | cc     The maximum correlation coefficient in the form
                             (b.bbbbbbb, giving a range of 1 to 0 in steps of 2^-7, or 0.0078125) 
    addr12 | write |  11   | reference string bytes 0 - 0+RL
    ...
    addr23 | write |   1   | unused
    addr24 | write |  32   | S[] string bytes 0 - 0+SL
    -------+-------+-------+-------------------
    

    That comes to 56, so I'll make it 64, for an address of 9 bits. addr56-63 are unused and can be filled with anything or left unwritten. The write and read channels see this data record as 16 32-bit accesses.

    Regarding the frameID at addr00: This is provided to aid the outside world's record keeping since processing can complete out-of-order. The SystemVerilog code for creating those data records in the testbench is here.

    Regarding the correlation coefficient at addr49: The absolute value of calculated correlation coefficients is returned, meaning that there is no possibility of taking negative correlations into consideration. This is mostly because they have no meaning here since it its merely a random step, up or down, of arbitrary symbols. Only the magnitude matters.

    Here are examples of the strings S, semi-randomized string HW, and the latter's integration into S. The gray box below shows a collection of 6 strings, each with different correlation coefficients. The text "At the fragment starting at" indicates where the subroutine HelloWorldCorrelator found the highest correlation. All correlations returned are positive as the absolute value was taken.
    The first string, with a correlation coefficient of 1.000, did not scramble HW. It also happened to be overlaid starting at S[0].
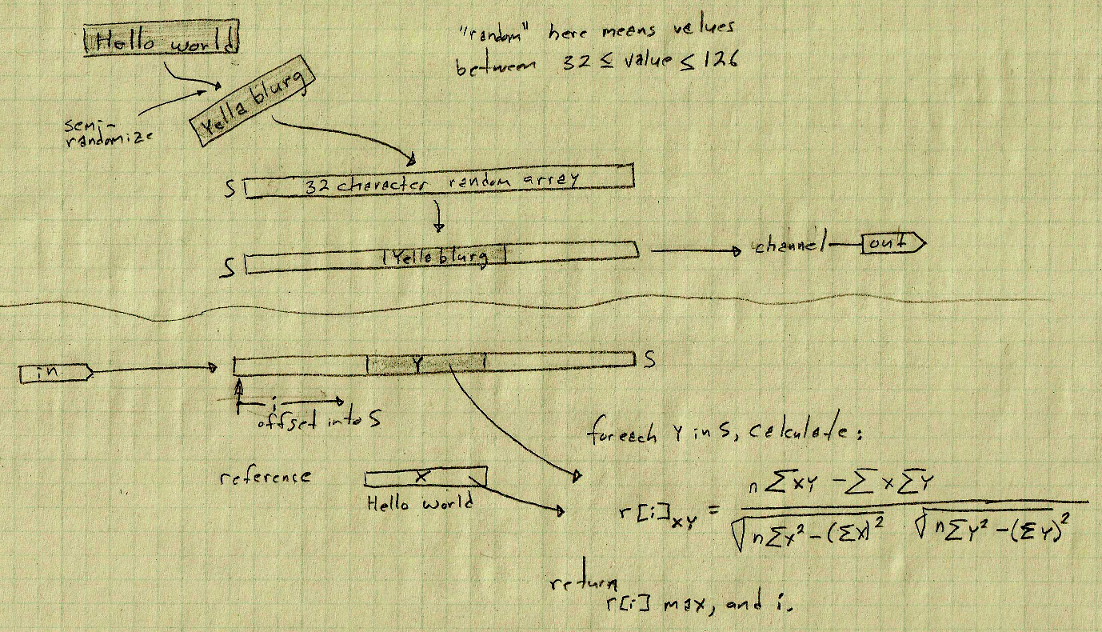
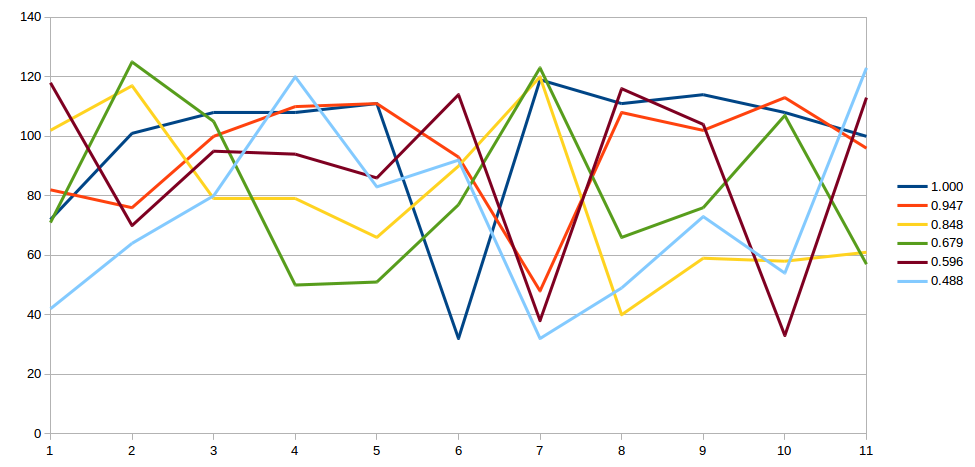
    At the fragment starting at 0
    --------------V
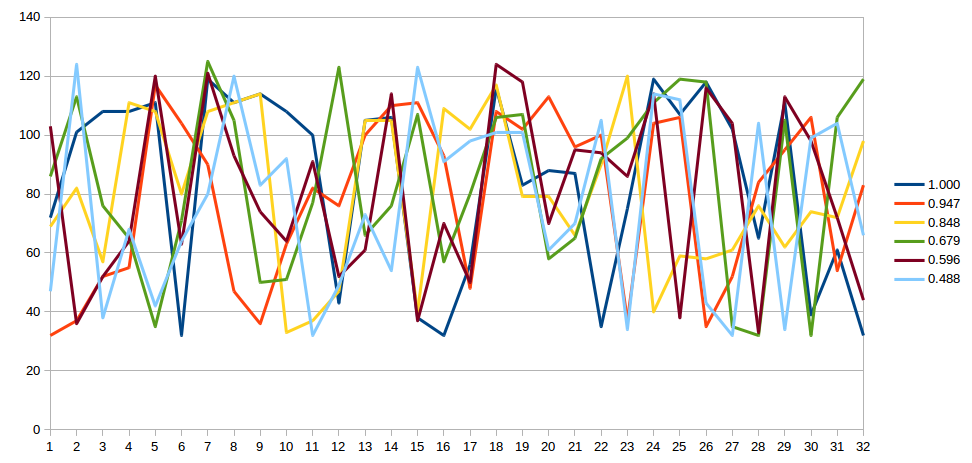
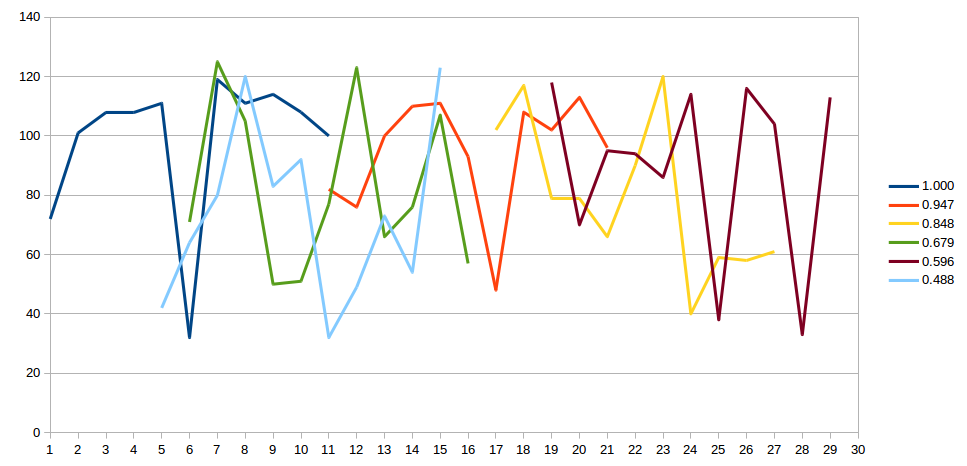
    The string is Hello world+ij& 8tSXW#KwkvfAo'= <=-  
    Correlation coefficient w.r.t "Hello world" is  is 1.000
    
    At the fragment starting at 10
    ------------------------V
    The string is U4f(7(8d*wFHkdm(neoZceRGb@]0 joQ
    Correlation coefficient w.r.t "Hello world" is  is 0.921
    
    At the fragment starting at 17
    ------------------------------V
    The string is ER9olPlor!%/ii(mfuOOBZx(;:=L>JHb
    Correlation coefficient w.r.t "Hello world" is  is 0.848
    
    At the fragment starting at 6
    --------------------V
    The string is VqLA#G}i23M{BLk9Pjk:A\cowv# i jw
    Correlation coefficient w.r.t "Hello world" is  is 0.679
    
    At the fragment starting at 19
    --------------------------------V
    The string is g$4@x?y]J@[4=r%F2|vF_^Vr&th!qbH,
    Correlation coefficient w.r.t "Hello world" is  is 0.596
    
    At the fragment starting at 5
    -------------------V
    The string is /|&D*@PxS\ 1I6{[bee=Fi"rp+ h"chB
    Correlation coefficient w.r.t "Hello world" is  is 0.488


    The plot below show each of the 6 32-character strings plotted with their correlation coefficients. (Can you see the match strings?)


    The plot below shows only the 11-character blocks within each of the 32-character strings where the highest match was detected.


    The plot below shows only the 11-character block in each of the 32-character strings which contained the highest match, all aligned with one another.


    A bit more elaboration on this, see the gray box below where the offsets for each character in S w.r.t HW are given:
    At the fragment starting at 10
    ------------------------V
    The string is U4f(7(8d*wFHkdm(neoZceRGb@]0 joQ
    Correlation coefficient w.r.t "Hello world" is  is 0.921
    F + 2 = H
    H +29 = e
    k + 1 = l
    d + 8 = l
    m + 2 = o
    ( - 8 =  
    n + 9 = w
    e +10 = o
    o + 3 = r
    Z +18 = l
    c + 1 = d
    
    Note: The strong positive bias on my random number generator has since been fixed.

    The entire testbench and DUT are on EDAplayground.
    For quick orientation, here are some rough first pass diagrams, reduced size ('view image' to enlarge):
    HWSP block diagram:
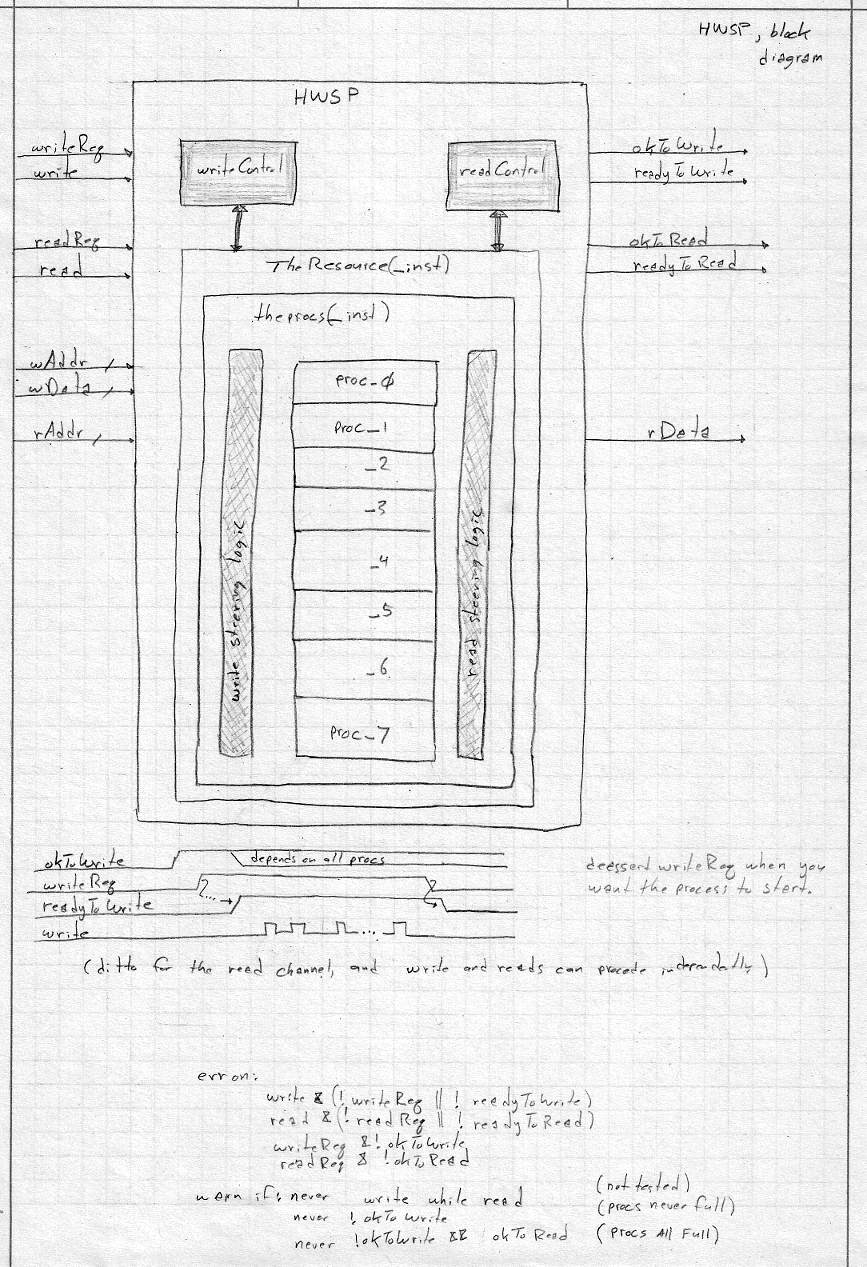
    theprocs block diagram:
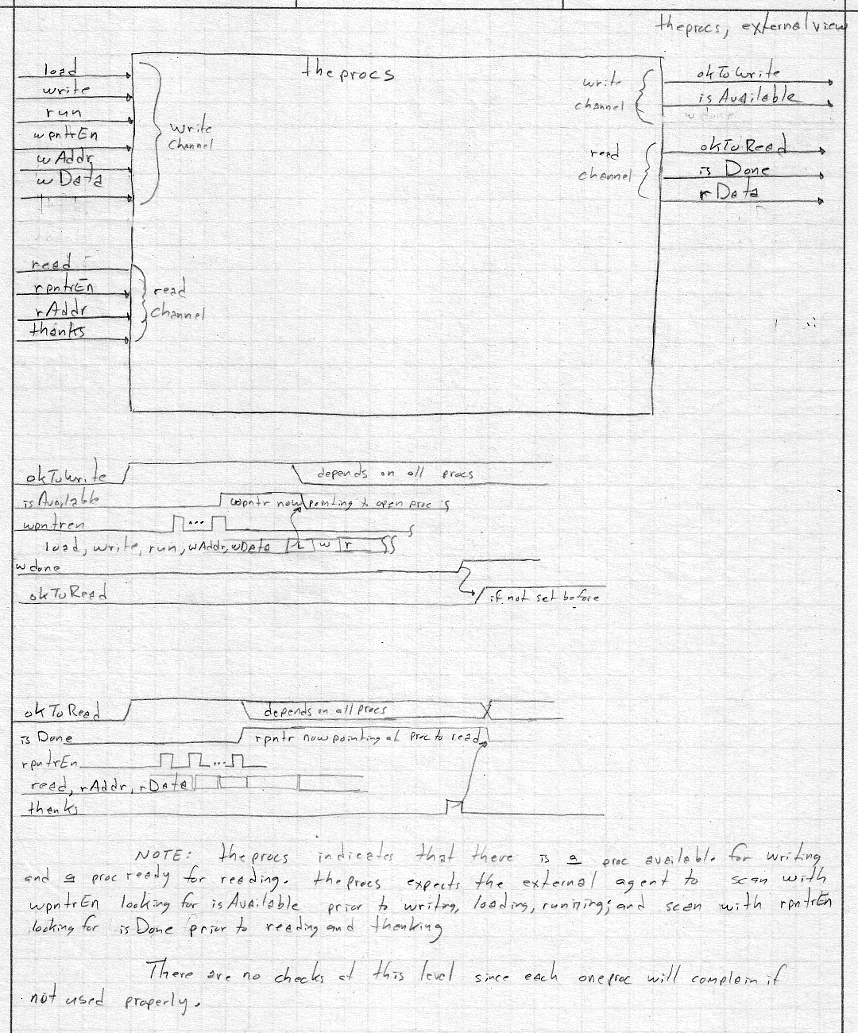
    theprocs internal diagram:
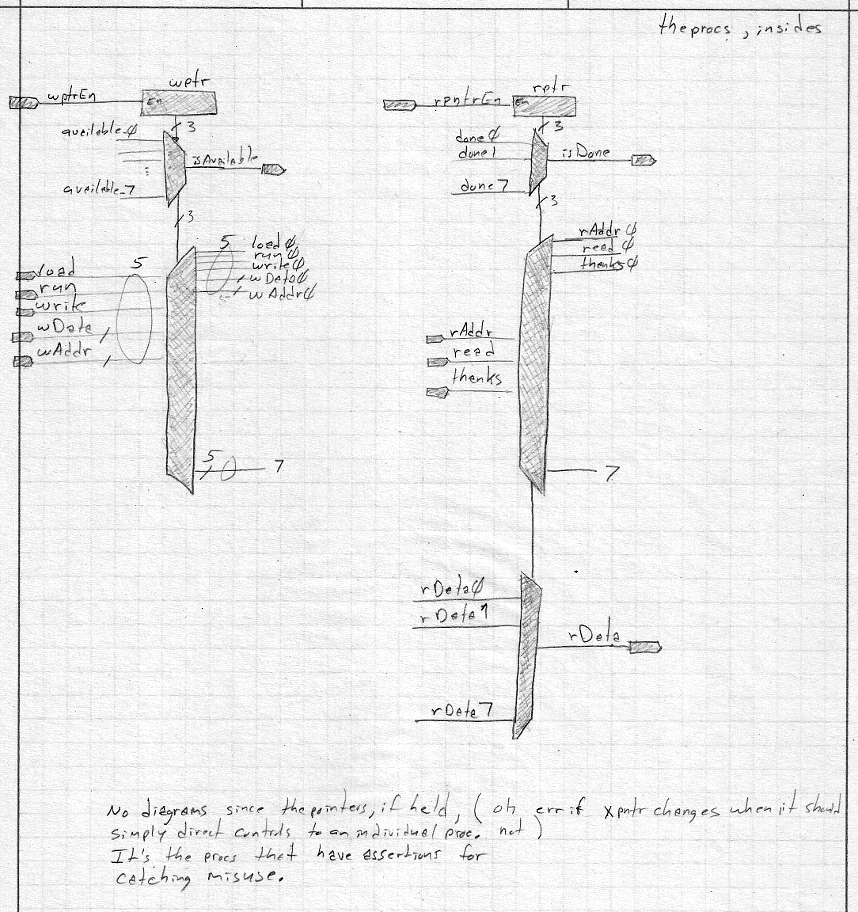
    oneproc block diagram:
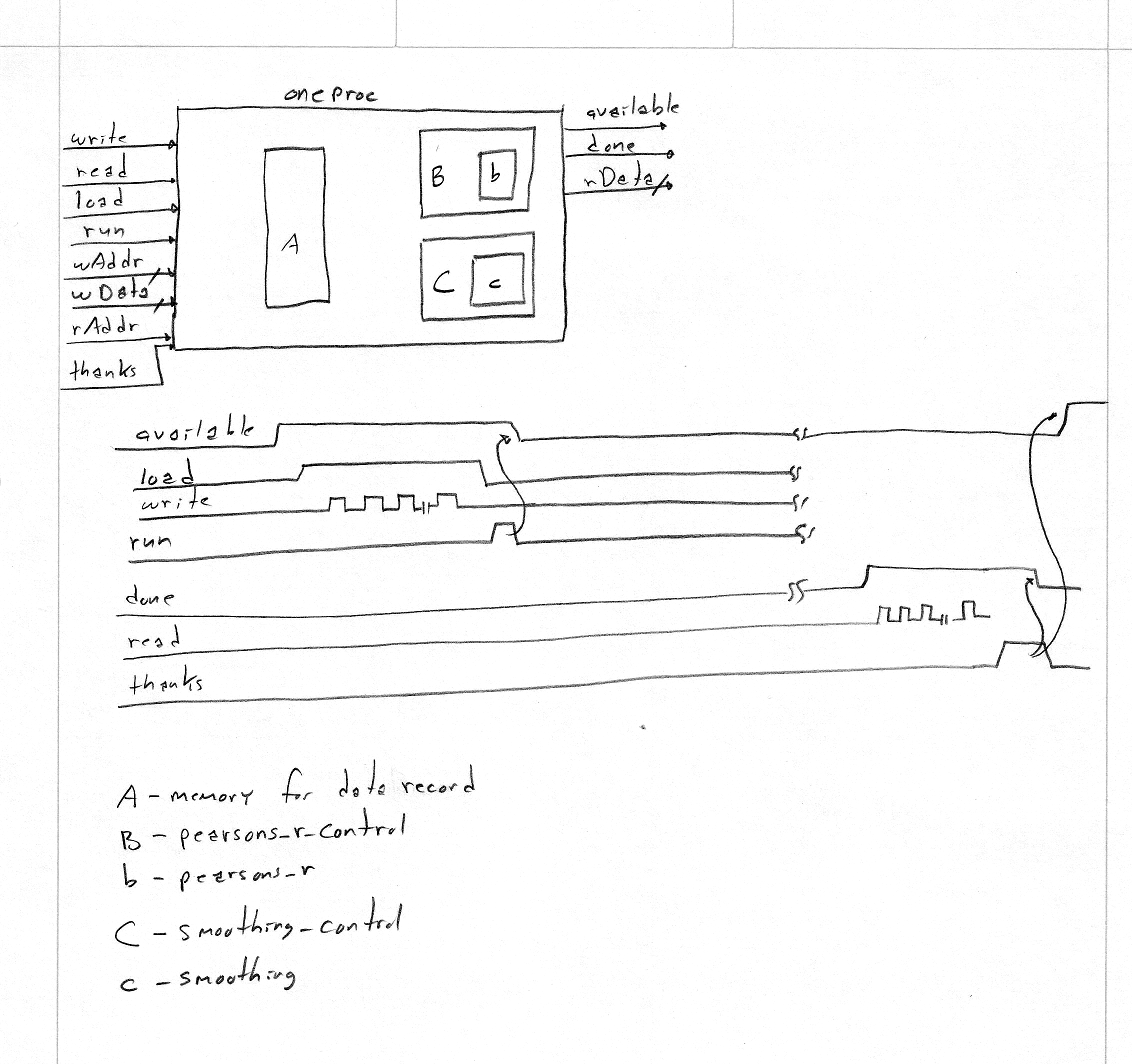
    oneproc internal diagram:
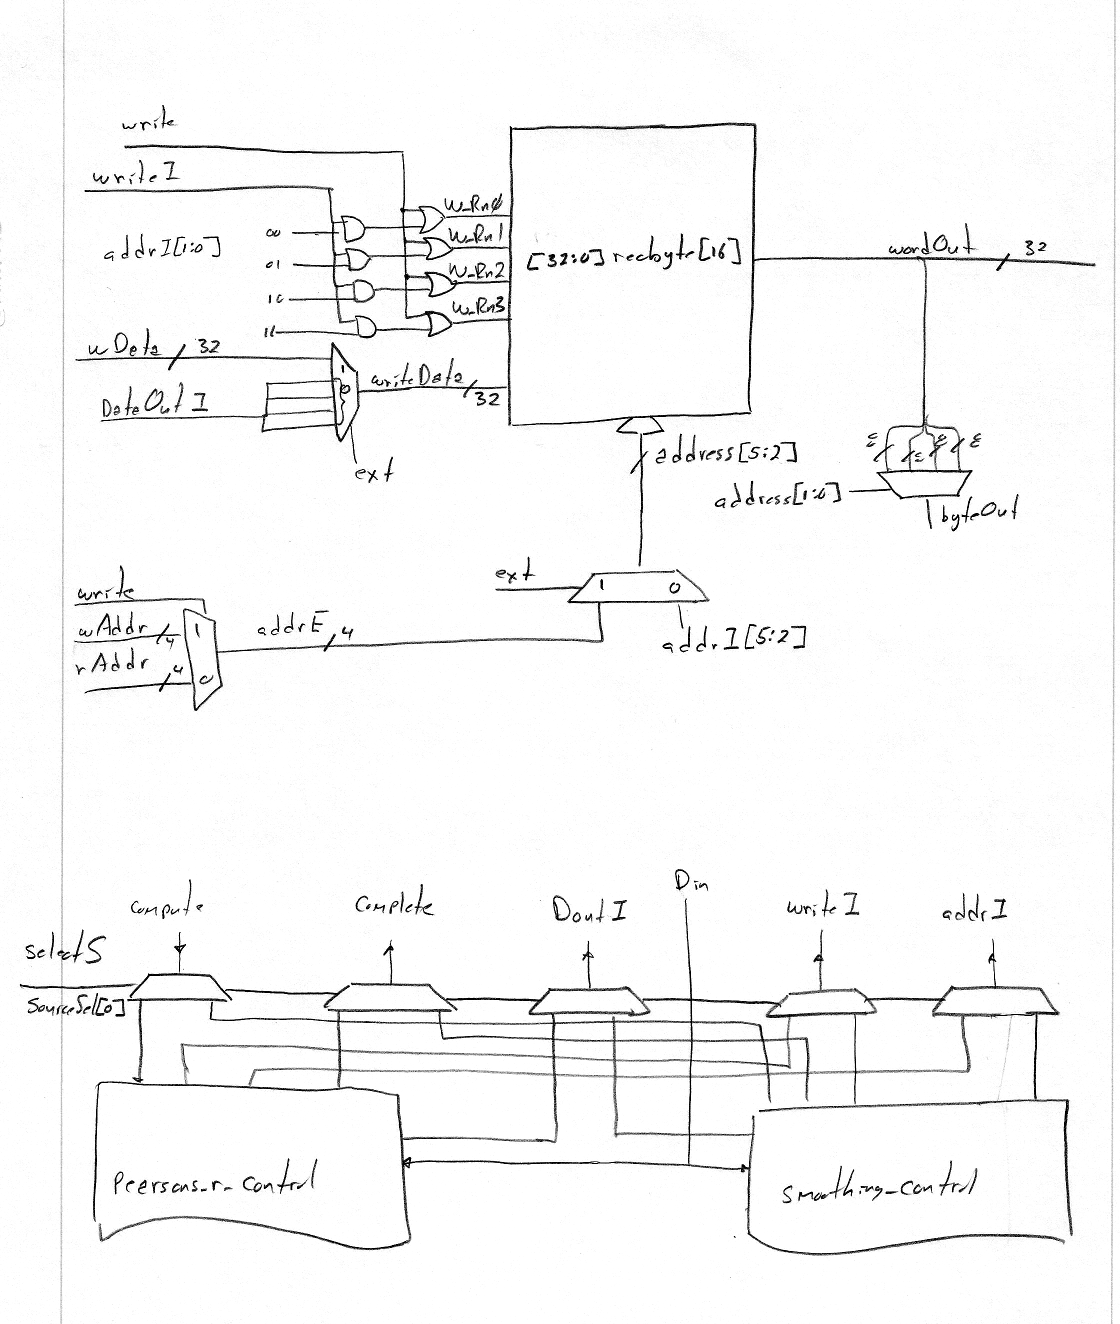
    pearsons_r internal diagram:
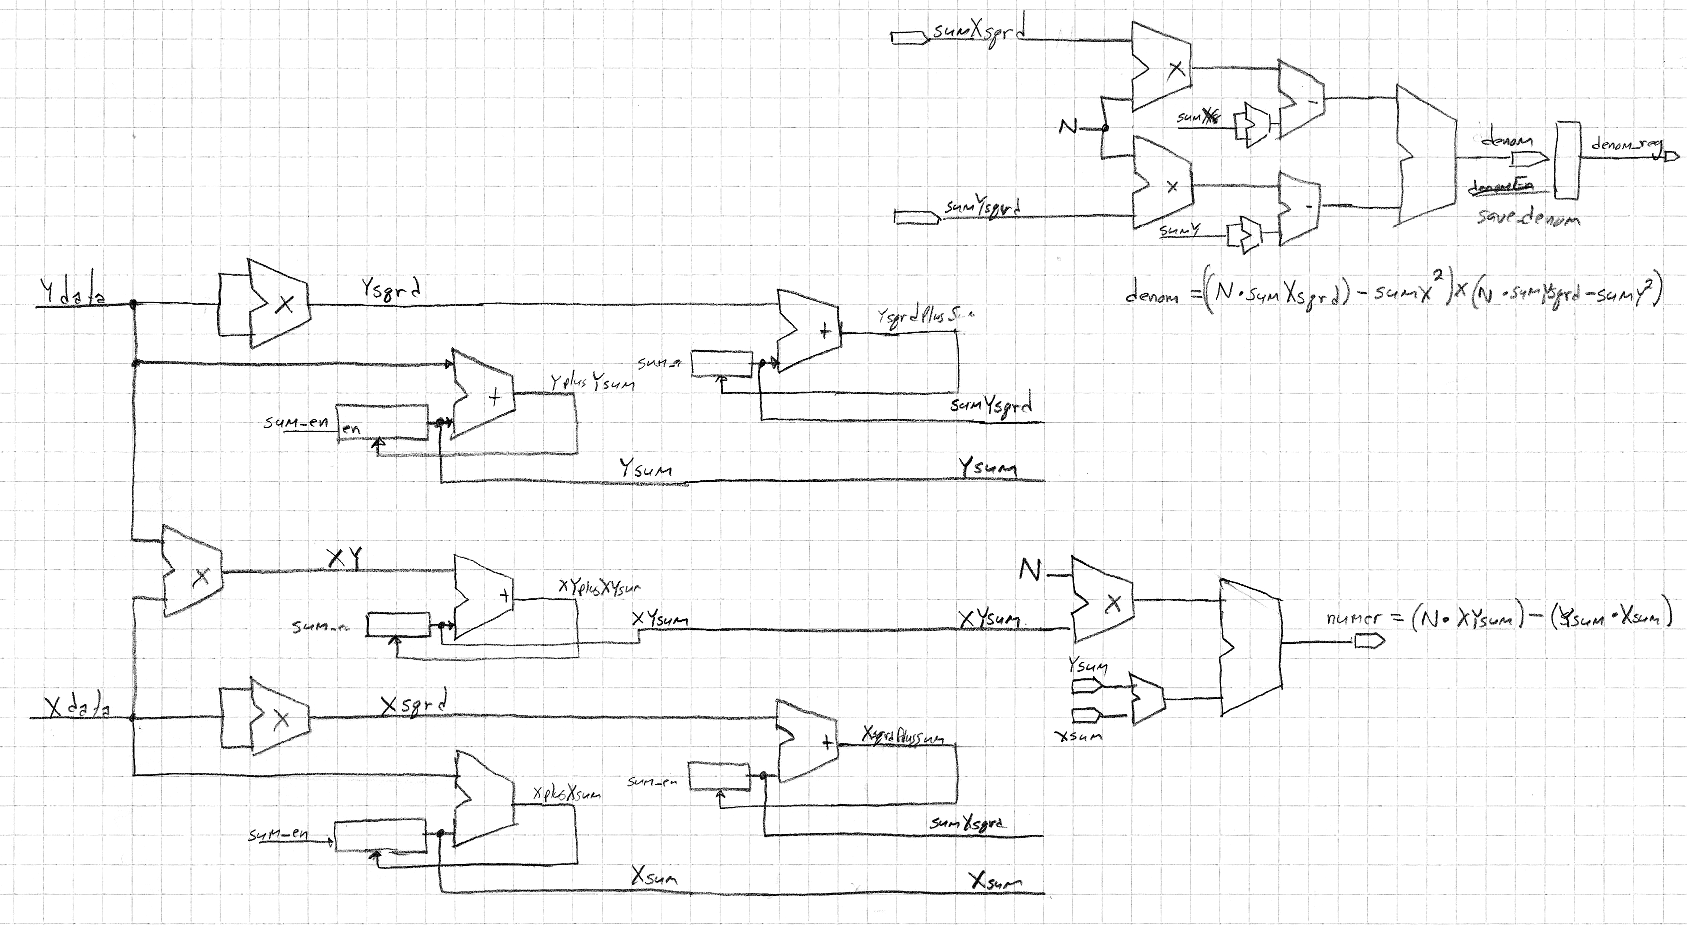
    pearsons_r_control internal diagram:
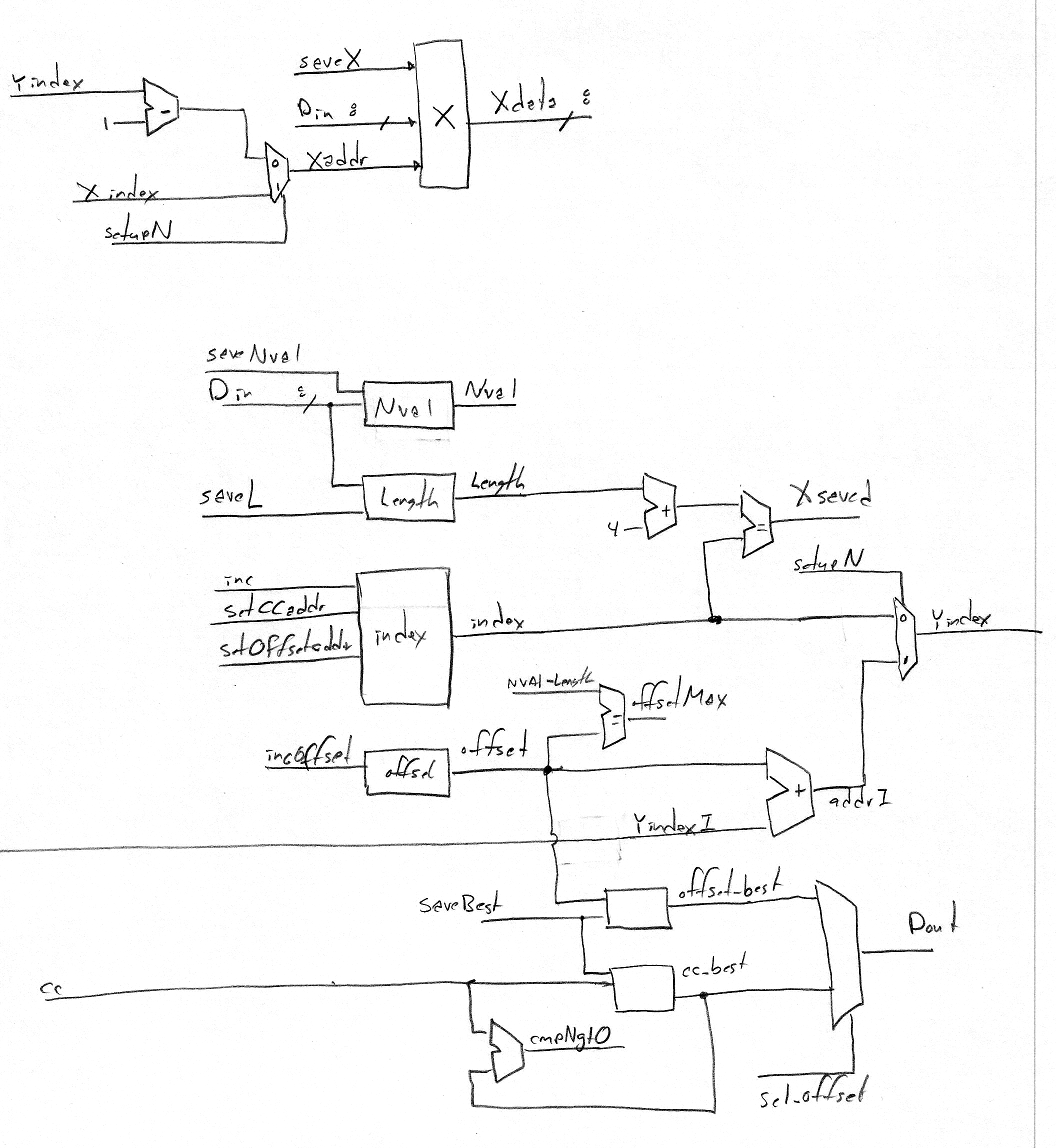
    smoothing_control internal diagram:
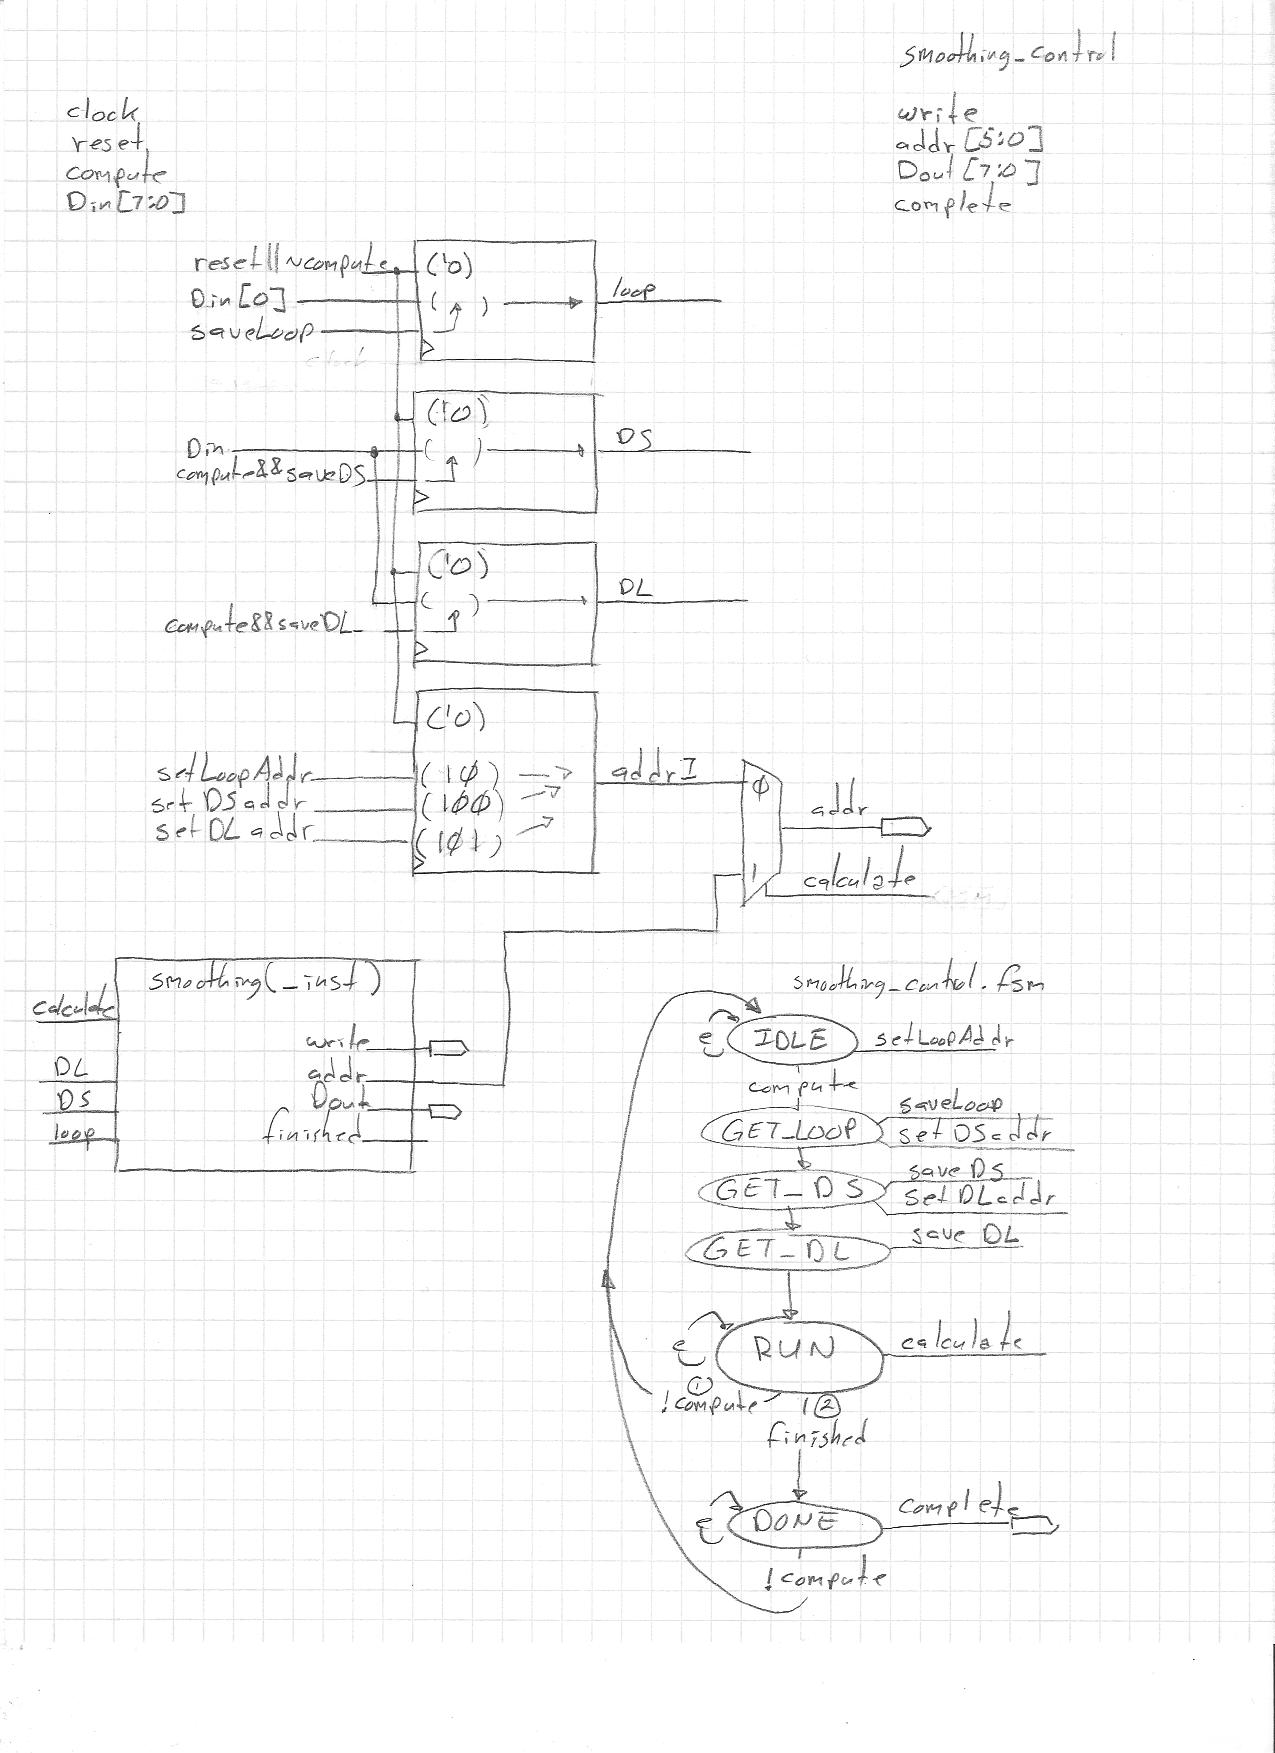
    smoothing internal diagram:
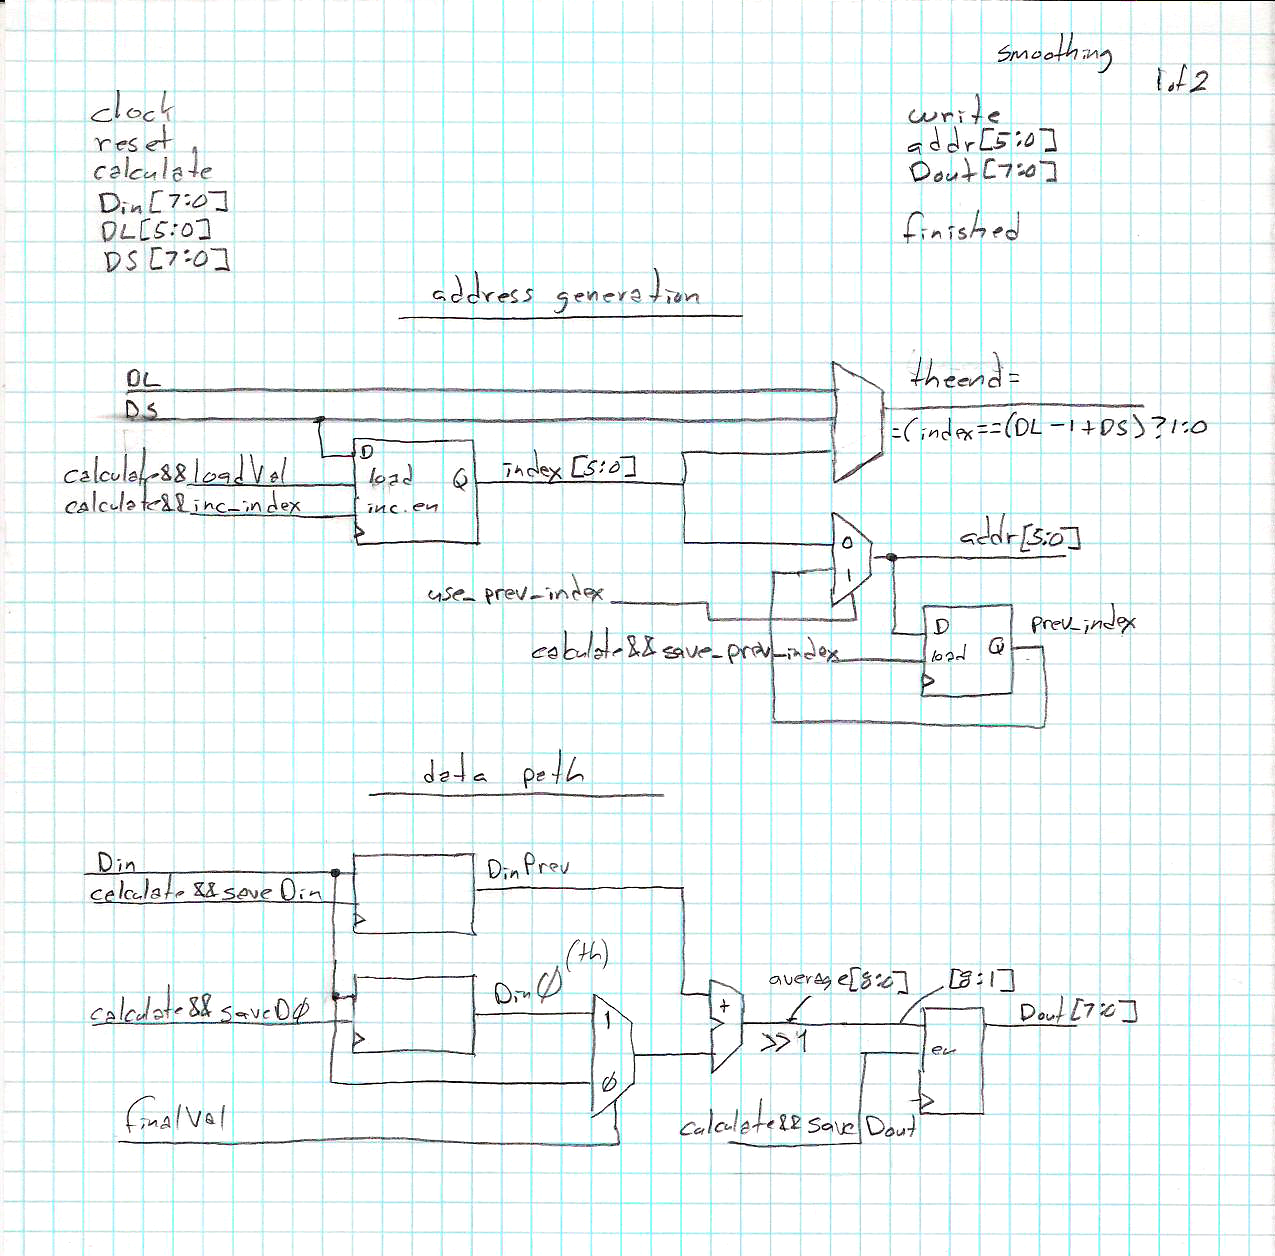
    smoothing FSM:

    The smoothing function


    Detecting a crippled "Hello world" string is the primary function of the HWSP. But the oneproc unit also includes a totally gratuitious smoothing function. Pass it the correct command and an array of data and it smoothes the data in place. The function is:
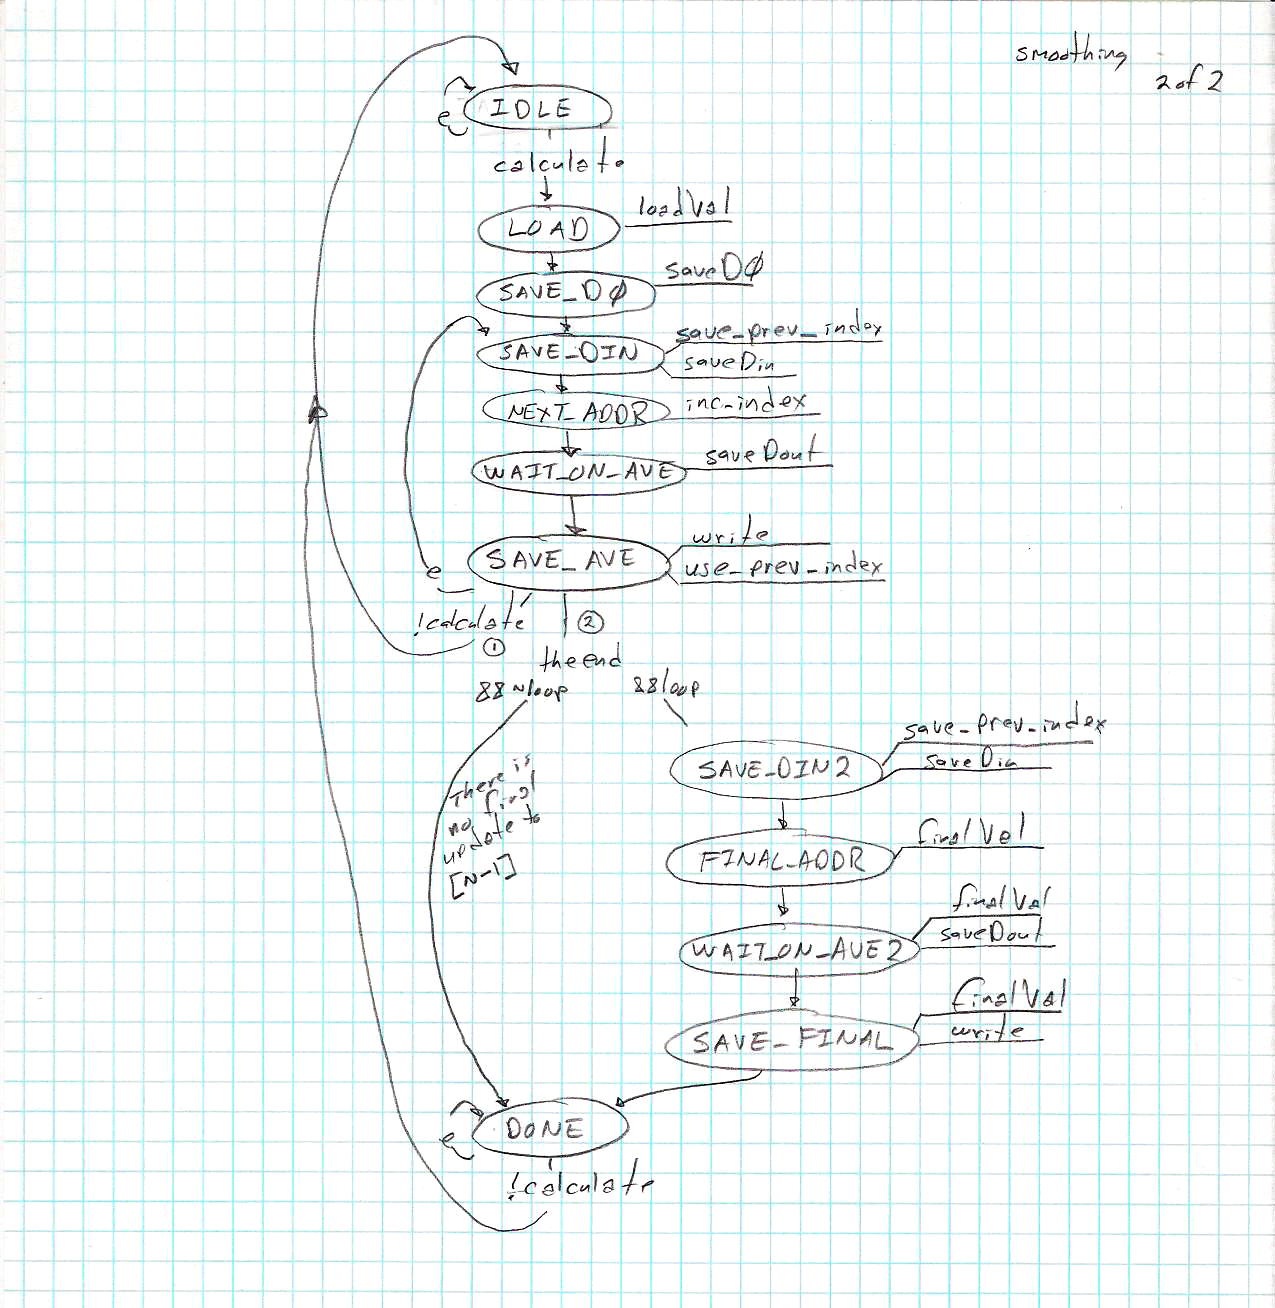
    Given an N element array S, and a select signal to
    choose how to handle the final entry in the array,
    S0 = S[0] ;
    for (i=0; i < N-1; i++)
      S[i] = (S[i] + S[i+1])/2;
    S[N-1] = (select) ? S[N-1] : (S[N-1] + S[0])/2 ;
    
    This function is incorporated in the testing since the logic for switching functions can't be tested without more than one function. This makes HWSP an 8-processor 2-function Stream Processor.
    For a first pass check of this averaging function I:
    1. created an entry in dut_pkg.svh to describe the data frame,
    2. created a data frame of an array of 32 random bytes and a command of "SMOOTH",
    3. ran that data through the oneproc unit 20 times, leaving the previously smoothed data as to be smoothed again,
    4. had the scoreboard print out the contents of the array, after each pass, and
    5. gave that data to gnuplot.
    Here is an image of the 20 times repeated averaging (green shows the initial array values):

    I don't know if it's right yet because I haven't written the scoreboard, but it looks good enought to submit for testing. The tiny bit of scriptwork to get from the UVM messages to a plot can be found in the smoothing directory.


    This is a work in progress