So what do you do?
This page offers a suggestion.
It is also up on EDA Playground here:

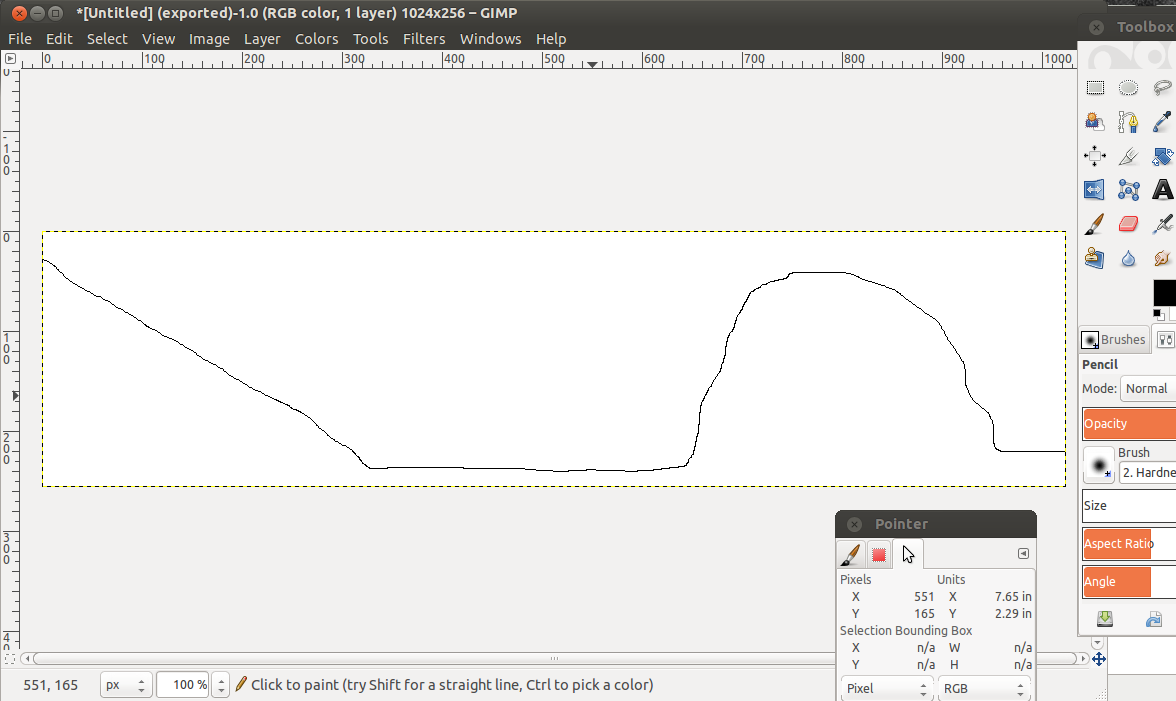
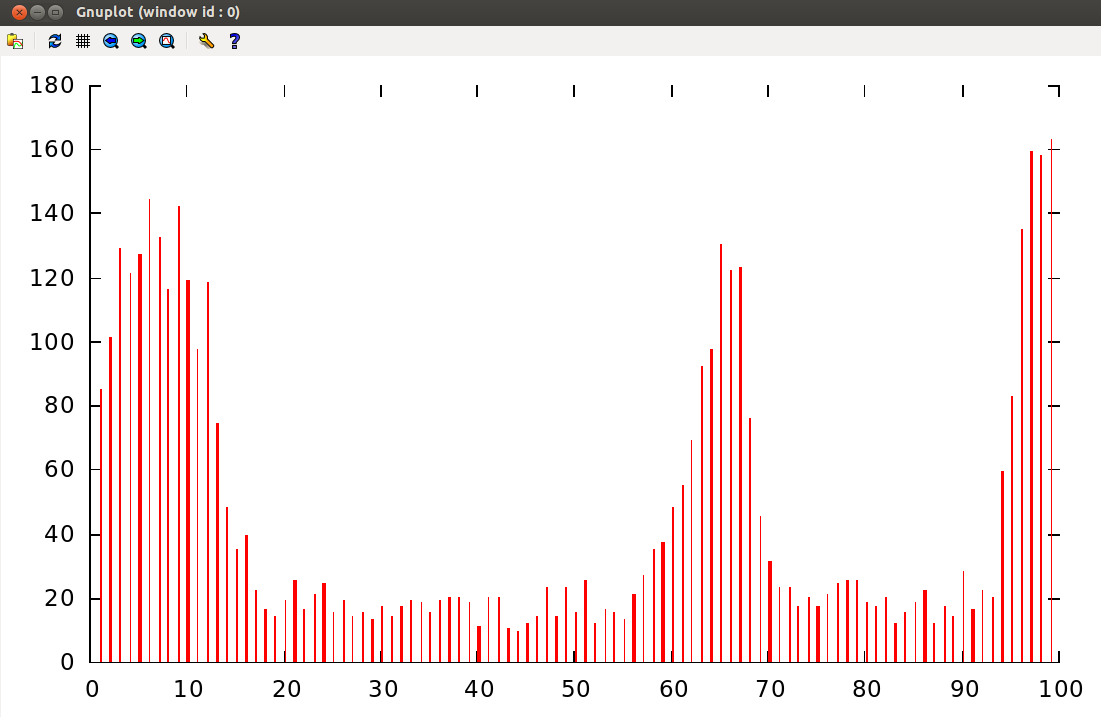
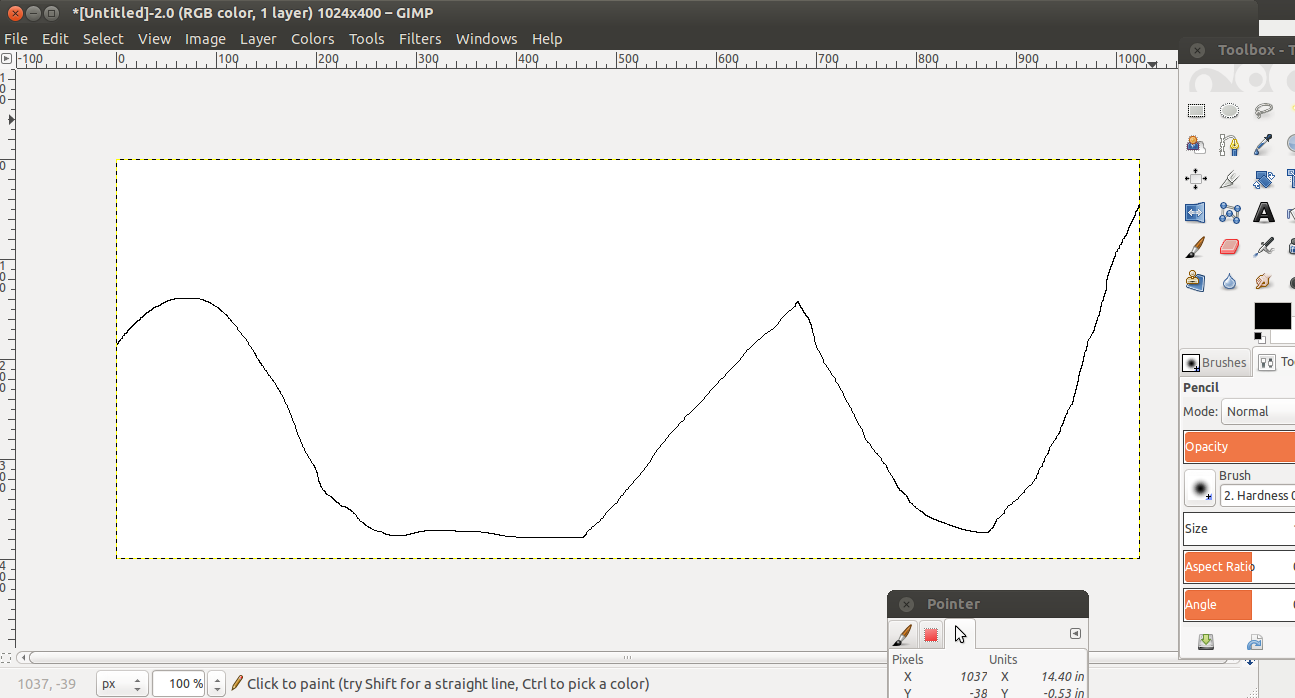
So there you are working diligently away doing your ASIC Verification Engineer thing and writing complicated constraints and there are no cases of corners out of your reach and your boss says, "OK smartypants, let's see you make a random distribution like this," and then your boss scribbles some arbitrary curve that does not look readily amenable to a simple mathematical expression.
So what do you do?
This page offers a suggestion.
It is also up on EDA Playground here:
| • $random | • $dist_chi_square | • $dist_erlang |
| • $dist_exponential | • $dist_normal | • $dist_poisson |
| • $dist_t | • $dist_uniform | • expression dist { dist_list } ; because you can dist across a list. |
|
... int theData ; ... theData = dist_arbitrary (MinValue, MaxValue) ; ... |
pre_randomize function uses a DPI-C call to set up
class box_t;
  static int firsttime = 1 ;
  int theData;
  //             ------  NOT A COMMENT TO IGNORE  -------
  //  The constraint below is what I'd like to mimic, but SystemVerilog
  //  does not have an arbitrary distribution function. So I made one.
  //  constraint  the_index
  //  {
  //    theData = $dist_arbitrary (`X_MINVAL, `X_MAXVAL);
  //  }
  //  Note that the variable 'theData' is NOT rand, because all the work
  //  happens on the C-side in pre-randomize and we can't have 'theData'
  //  being scrambled after its holiday visit to the C-side.


  function void pre_randomize();
    if (firsttime == 1)
    begin
      firsttime = 0 ;
      theData = dist_arb(0, `X_MINVAL, `X_MAXVAL) ; // theData here is tossed
    end
      theData = dist_arb(1, `X_MINVAL, `X_MAXVAL) ;
  endfunction : pre_randomize
endclass : box_t
|
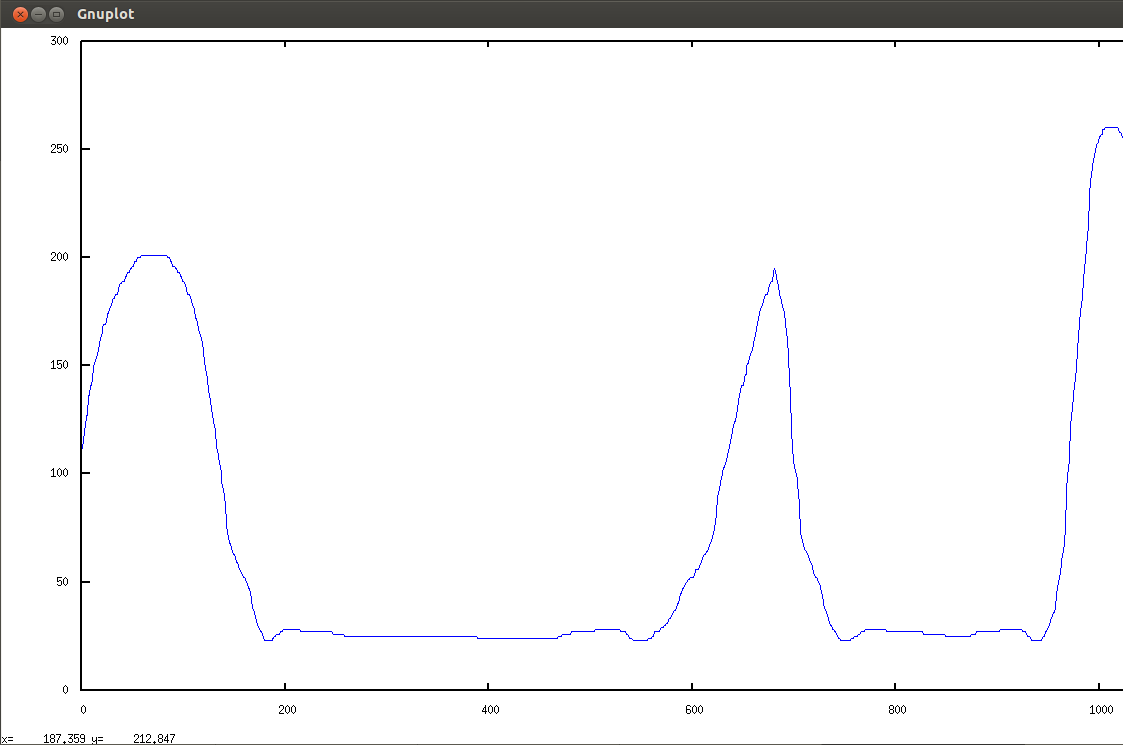
% more htmlFromPngToCSV.pl
#!/usr/bin/perl
$rowcount = 0 ;
$colcount = 0 ;
while (<STDIN>)
{
if ($_ =~ /\<TR\>/)
{
$rowcount++ ;
$colcount = 0 ;
}
elsif ($_ =~ /BGCOLOR(.*?)/)
{
if ($_ =~ /.*?#\d+/)
{
$PLOT[$colcount] = $rowcount ;
}
$colcount++ ;
}
}
$ymax = $rowcount ;
foreach $col (@PLOT)
{
$inverted = $ymax - $PLOT[$col] ;
print ("$inverted\n") ;
}
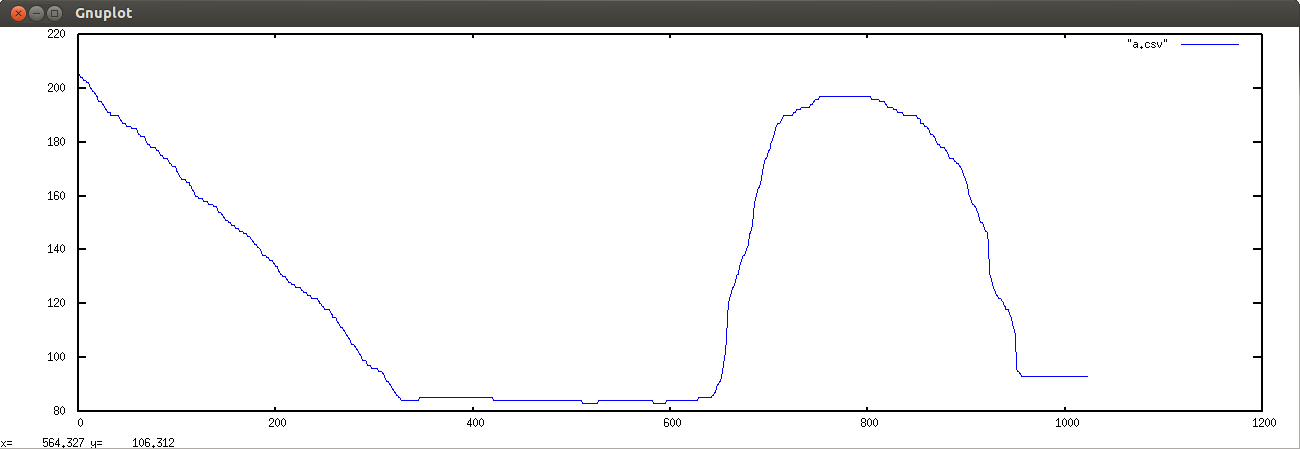
% cat Untitled.html | ./htmlFromPngToCSV.pl > arbitrary_distribution_file.txt
|
% more a.dat set terminal png ; set output "test.png" ; plot "arbitrary_distribution_file.txt" w lines lc 3 ; set terminal x11 ; replot % gnuplot -background white -persist a.dat |
theData = dist_arbitrary (MinValue, MaxValue) ; |
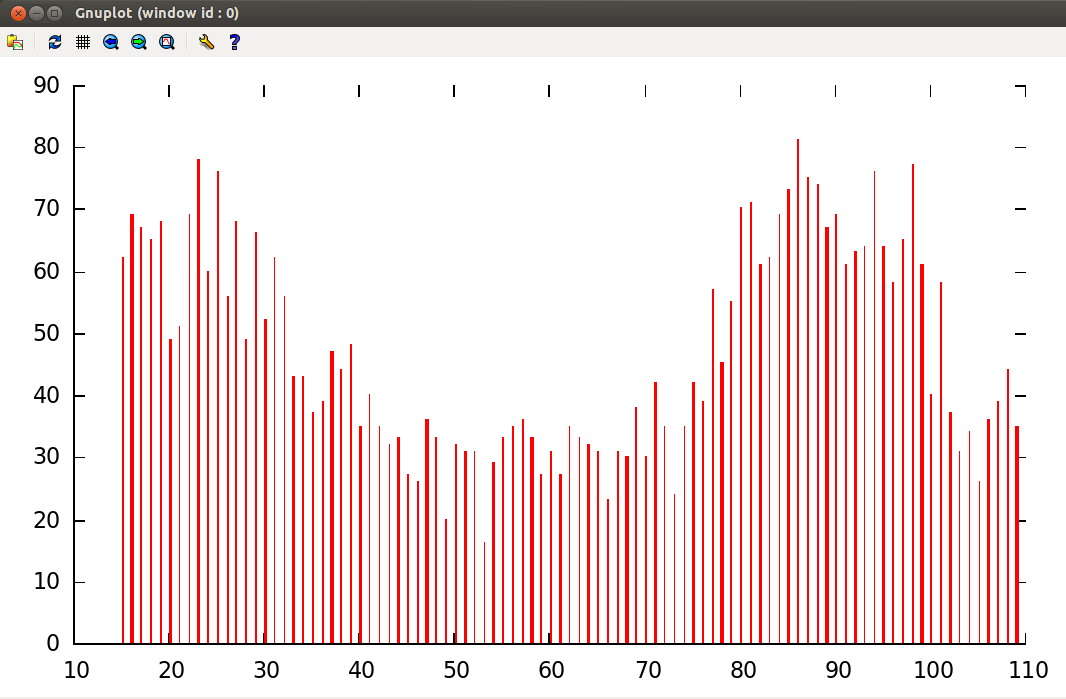
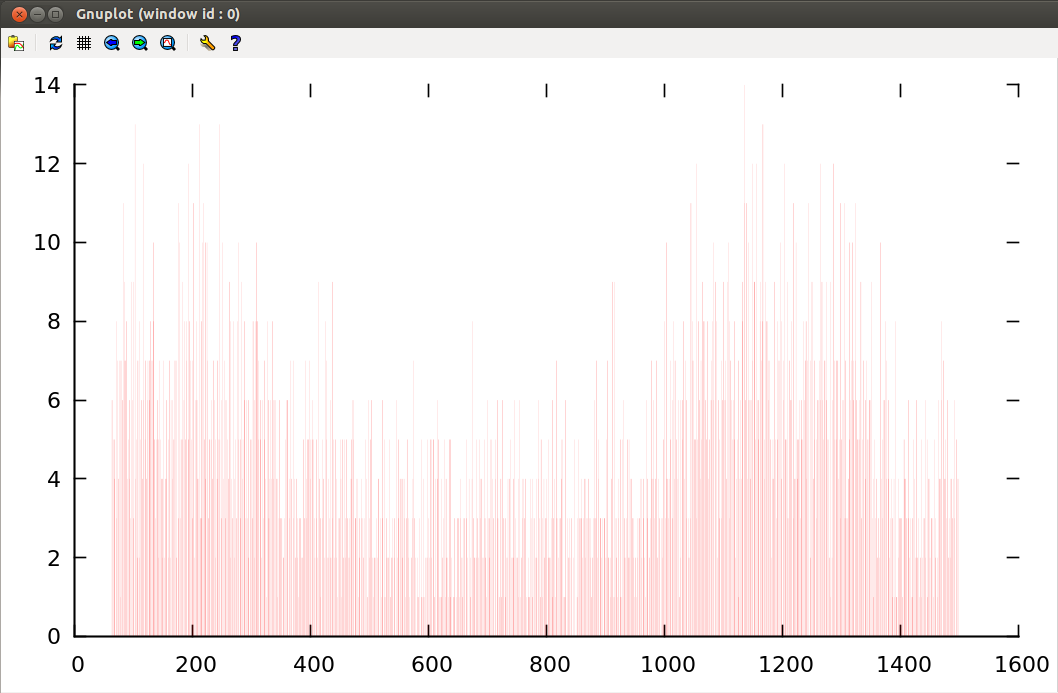
dist_arb.c performs both| Conversion 1: Making the probability distribution
This comes straight out of a box, in this case a genetic algorithm box. There is a GA description here A Genetic Algorithm Demo project, but the basic idea is to create what is called a Weighted Wheel, which is an array containing Y0@X0 values of X0, Y1@X1 of X1, ... Yn@Xn of Xn. For a distribution of three values, 1, 2, and 3, which has 20% probability of 1, 50% probability of 2, and 30% probablilty of 3, the array looks like this:
Chosing any index into the array gets a return value in the ratios shown above.
|